One of the biggest debates when it comes to education, is that of the ever-increasing graduation rates that many districts across the country are experiencing, as well as doing their fair share of bragging when it comes to those numbers. Whether you believe the rates are, or are not, inflated, one thing that is apparent is that there is simply no consistency from one school to the next when it comes to what is necessary for a student to receive their diploma. There is no denying that the graduation rates are, for the most part, approaching the horizontal asymptote of 100%, but most parents are growing wiser and starting to come to the realization that a 98% graduation rate at one school is not the same as a 98% at another school.
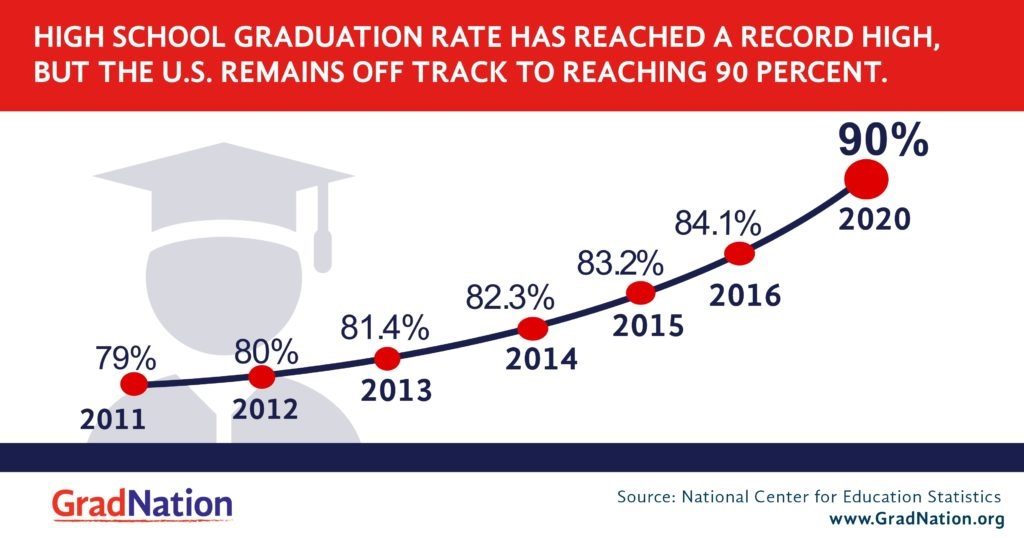
A Google search for “national graduation rates” will yield plenty of graphs that look like the one below. I also have no doubt, that by the year 2020 (as long as everything remains status quo), the majority of graduation rates across the country will be hovering around 90%.
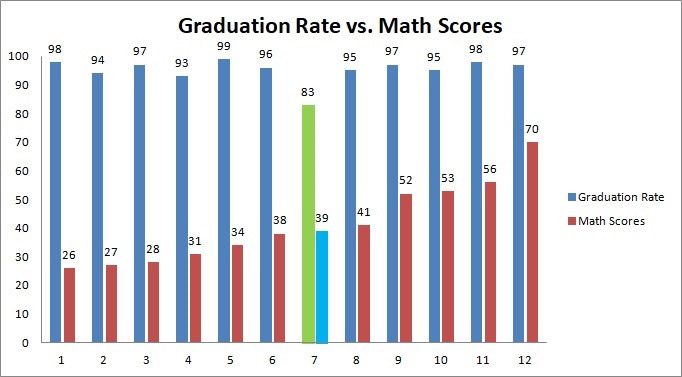
The graphs below of a few schools in the area show a slight discrepancy when it comes to how much students are learning versus that of their graduation rates. Granted, test scores aren’t everything; but being someone that works at one of the first four schools on the list, I can assure you that many of the students that make up our near 100% graduation rate are barely capable of understanding 5th grade arithmetic. And yet, every year, those students manage to earn get the credits necessary to be part of the annual procession that represents nothing more than academic fraud. That leaves this question: How is it that students—those who barely understand nothing more than middle school arithmetic—get their credits necessary to graduate? Well, without getting into the nuances of those last-minute, backroom deals (as that is an article for another day, the current and most used approach for last-minute credits are that of online, credit-recovery classes), the majority of students—regardless as to whether or not they actually attended their classes—always end up getting the credits needed to receive their diploma.
As I mentioned, test scores aren’t everything. But regardless as to whether or not you are a fan of testing, they do tell an interesting story when it comes to what students at one particular school know versus that of the school’s graduation rate.
The first graph represents the math test scores versus that of the graduation rate. As you can see, there’s a slight inconsistency when it comes to how well, or not, students understand mathematics by the time that they graduate. The green and teal bars represent the state average.
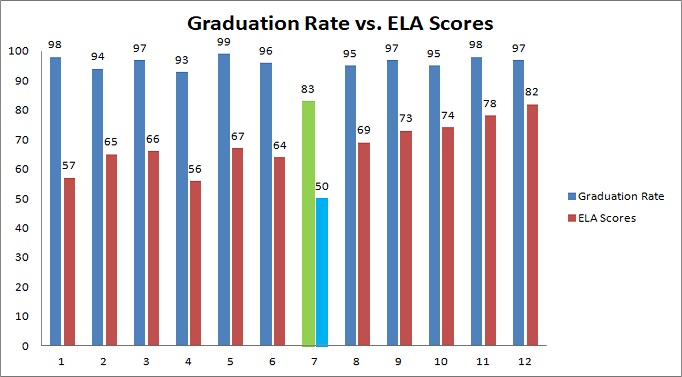
The schools seem to be doing a little better when it comes to the ELA portion of the End-of-Course (EOC) exams.
It really is a numbers game. District administration is aware that a high graduation rate will make the district look better in the hopes of drawing in more students to keep the funding spigot turned on. It’s not exactly a secret that the more students that attend a school, the more money the district will receive in annual funding. So by keeping the graduation rate as high as possible, there is a better chance that a school will keep the enrollment, and therefore the dollars, coming into the district. The goal is this: Keep the school’s image as nice as possible, and more parents will be willing to send their kids to that school. Sounds easy, right? The thing is, it isn’t quite working as well as those at the top like to think it is. After all, why send your students to school 1 when school 9 down the road—with better test scores—has the same graduation rate.
With social media as it is, and information being more accessible than it has ever been, many parents are realizing that the graduation rate might be there, but the learning isn’t. The administrative perception is that by keeping that rate as high as possible, then enrollment will also go in the same direction. And if you work in education, then you are fully aware that what administration thinks will work versus what actually does work, are—with very few exceptions—mutually exclusive.
As I mentioned, graduating nearly every student isn’t working for many of the schools. For the majority of the schools included on the graphs, enrollment has been on a steady decline for years. My current site of employment (even with its near 100% graduation rate) has the lowest enrollment, well, ever. In fact, the enrollment for the entire district is no more than that of a large high school, and is down about 40% in just the last 5 years alone. In other words, people are seeing through this farce of rising graduation rates and are realizing that the rates themselves are another desperate attempt by districts to increase their enrollment. Districts can try to use these numbers while concurrently burying the truth about drug use, fights, and any other safety issues that they consistently ignore. But just like anything, people are seeing through administrative shenanigans when it comes to using some good numbers in the hopes that no one will notice that bad.